Comprehending and Creating Diagrams
The following extract is taken from PETAA Paper 208, The Literacy of Mathematics, written by Jennifer Way and Janette Bobis.
A diagram is a structural representation, or spatial layout, of information (Deizmann & English, 2001). Knowing about the use of diagrams and being able to apply that knowledge appropriately has been referred to as diagram literacy, and identified as a component of visual literacy (Deizmann & English, 2001). The Australian Curriculum: General Capabilities: Literacy includes the statement that, in developing visual knowledge, students must “… understand how visual elements create meaning”. Unlike pictures, diagrams contain only the visual elements that are essential for depicting the relevant facts and relationships. Mathematics abounds in conventional graphics and diagrams such as number lines, graphs, area diagrams, geometric figures and maps, which students must learn to interpret, and also to create.
The capacity of diagrams to represent specific relationships between data, make them useful thinking tools in mathematical problem solving. When students effectively create their own diagrams during problem solving, they engage in a process of translating their reasoning and internal images into concise external representations. The process may be supported by knowledge of conventional diagrams and prior experience with similar problems. However, the complexities of recognising the essential data from the particular problem, and connecting them to the elements of a diagram, arranged in an appropriate spatial layout, make diagram interpretation and construction challenging activities for many students (Lowrie, Deizmann & Logan, 2012). Diagram literacy is an essential part of students’ development of both mathematical proficiency and visual literacy and, therefore, requires deliberate attention by teachers.
Diagram Talks
We propose diagram-talks as one approach that teachers can use to make explicit the construction and function of diagrams. Diagram-talks are based on the increasingly popular teaching strategy of number talks. Number talks “…are all about students and their ways of thinking” (Humphreys & Parker, 2015, p.5), and so are diagram-talks. However, diagram talks place greater emphasis on the teacher recording a student’s thinking using a diagram, while making explicit the connections between components of the student’s described strategy and elements of the drawn representation. In other words, the teacher models how to construct a diagram that effectively communicates the student’s reasoning and solution. The key pedagogical characteristic of this approach is that the teacher is modelling the student’s own thinking, not demonstrating the teacher’s way of thinking. The aim of diagram talks is to gradually familiarise students with basic forms of diagrams, that they can begin using as thinking tools during more complex problem-solving.
Using diagram talks to develop the use of empty number lines
In the following example of a diagram talk the teacher uses the general process of number talks, but with an emphasis on modelling how each student’s strategy can be represented by number-line diagrams (empty number lines). We also see talk moves being utilised to maximise student engagement, communication and understanding.
The teacher asked the class to work out 58 + 22, then waited a few minutes for students to think, and watched until most of the students had placed a raised thumb against their chests, and some had indicated more than one strategy by also raising a finger or two.
The teacher then invited several students to explain their solution, using talk moves to discuss each strategy. Once the calculation reasoning had been clearly explained, the teacher restated the strategy as she drew a number-line diagram to illustrate it. Two examples appear here:
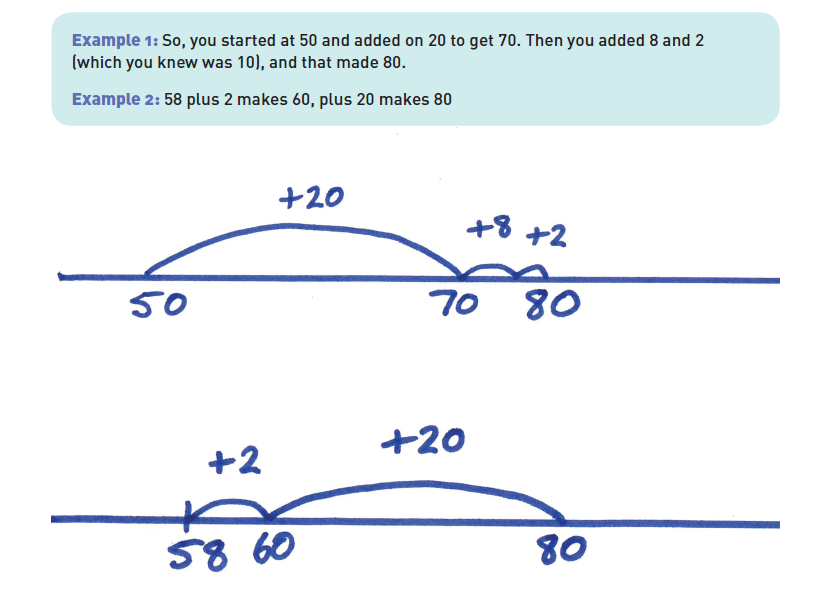
Two examples of teacher-drawn diagrams of student calculation strategies.
Finally, the teacher drew another number-line diagram that represented a different strategy (see below) and asked the students to interpret it, and explain how the strategy worked. After some individual thinking time and waiting for the readiness hand signals, the teacher used the talk move of turn-and-talk, before calling on someone to verbalise the strategy.
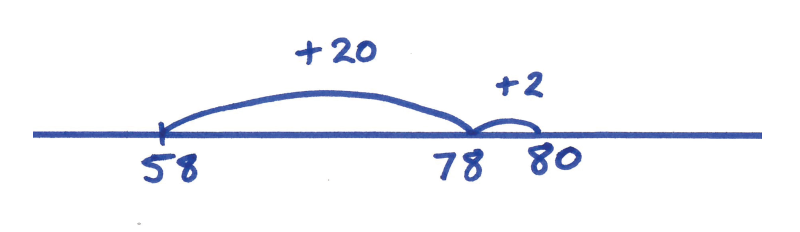
Teacher-created diagram for students to interpret.
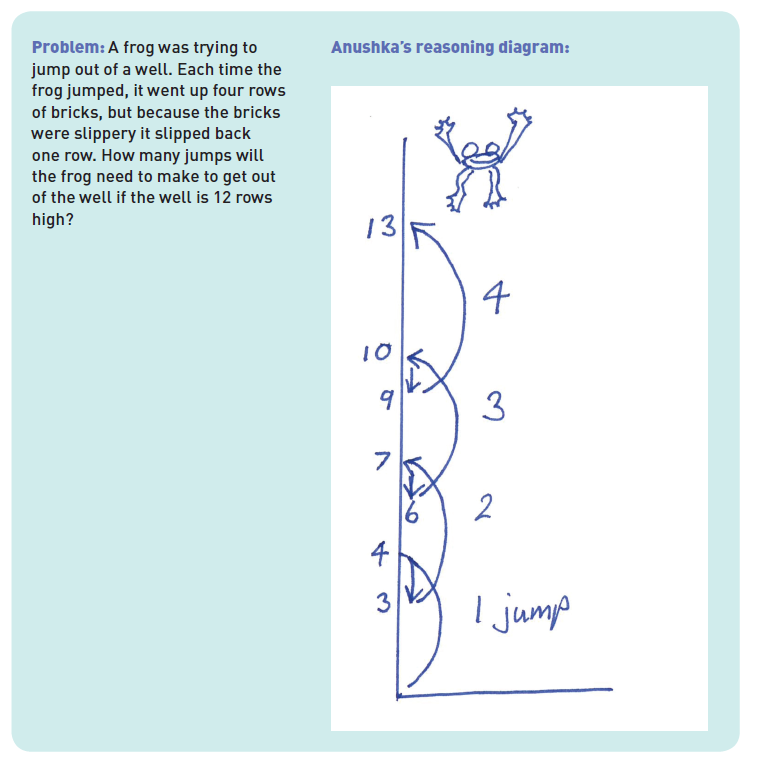
The teacher conducted several similar diagram talks involving basic addition and subtraction problems over two weeks, then encouraged the students to begin drawing their own diagrams. Once the class had gained familiarity with using the number-line diagram as a communication tool, the teacher’s goal shifted to encouraging the students to use it as a thinking tool. To achieve this, the teacher increased the complexity of the number problems in three different ways by: introducing three-digit numbers to extend the mental calculation challenge; using word problems to contextualise the mathematical reasoning; and using problems that required more varied use of the number-line structure (See below). The students were asked to record their problem-solving process on paper before solutions were shared and discussed. During discussion, the construction of the diagram and the reasoning behind it, were highlighted.